
2026 Point-in-Time (PIT) Count Report
Maricopa Regional Continuum of Care
Overview
9,726
people experiencing homelessness
in Maricopa County on the night of January 26, 2026
53%
Sheltered
in Emergency Shelter, Transitional Housing, or Safe Haven Programs
47%
Unsheltered
on the streets or other place not meant for human habitation
What is the PIT Count?
The Point-in-Time (PIT) Homeless Count is an annual street and shelter count that determines the number of people experiencing homelessness in Maricopa County during a given point in time. Conducted on a single day in January, this project includes a brief survey to identify the needs and characteristics of those experiencing homelessness. Every Continuum of Care is required to submit PIT Count results to the U.S. Department of Housing and Urban Development (HUD) as part of a national effort to identify the extent of homelessness across the country.
Why is it important?
The PIT Count is an important source of data on homelessness, and is reported to Congress as part of the Annual Homelessness Assessment Report (AHAR). The PIT Count is a source of unsheltered homeless numbers and helps to inform communities on the number of people who do not access services such as Emergency Shelters or Transitional Housing at any given point in time. As the number of people experiencing homelessness continues to rise across the region, increased regional efforts to address homelessness are necessary.
The PIT Count is a one-night snapshot of homelessness that is limited by weather conditions, number and training of volunteers, self-reported survey responses, and other factors. There are more people who experience homelessness over the course of the year than on any given single night. Every year, the Continuum of Care works towards improving the count's accuracy. The Maricopa Regional Continuum of Care is committed to using data from the PIT Count and the regional Homeless Management Information System (HMIS) to understand more about the population experiencing homelessness in the region and to provide solutions that will make homelessness rare, brief, and non-recurring.
The overall PIT count stayed nearly the same, with fewer people unsheltered and more people connected to shelter.
Total PIT Count, 2020–2026
| Year | Unsheltered | Safe Outdoor Space | Sheltered | Total |
|---|---|---|---|---|
| 2020 | 3,767 | — | 3,652 | 7,419 |
| 2021* | Count not conducted due to the pandemic | — | ||
| 2022 | 5,029 | — | 3,997 | 9,026 |
| 2023 | 4,908 | — | 4,734 | 9,642 |
| 2024 | 4,076 | — | 5,359 | 9,435 |
| 2025 | 4,987 | 220 | 4,527 | 9,734 |
| 2026 | 4,366 | 201 | 5,159 | 9,726 |
Source: Maricopa Regional Continuum of Care PIT Count, 2020–2026. *The PIT Count was not conducted in 2021 due to the pandemic.
Demographics
The demographics of the PIT Count have been consistent over the past few years. The figures below show data from the 2026 PIT Count.
Sex
- Male — 63%
- Female — 37%
| Category | Percent |
|---|---|
| Male | 63% |
| Female | 37% |
Age
| Age group | People | Share |
|---|---|---|
| Children, 0–17 | 1,322 | 14% |
| Youth, 18–24 | 634 | 7% |
| Adults, 25–34 | 1,938 | 20% |
| Adults, 35–44 | 2,162 | 22% |
| Adults, 45–54 | 1,611 | 17% |
| Adults, 55–64 | 1,417 | 15% |
| Older Adults, 65+ | 642 | 7% |
| Total | 9,726 | 100% |
Race
| Race/ethnicity category | Share |
|---|---|
| White | 45% |
| Black, African American, or African | 29% |
| Hispanic or Latina(e)(o) | 16% |
| American Indian, Alaska Native, or Indigenous | 6% |
| Multi-Racial | 3% |
| Asian | 1% |
| Native Hawaiian or Pacific Islander | 1% |
| Middle Eastern or North African | <1% |
Ethnicity
Comparison: Sheltered and Unsheltered Populations
By race
| Race/ethnicity category | Unsheltered | Sheltered |
|---|---|---|
| White | 49% | 41% |
| Hispanic or Latina(e)(o) | 18% | 14% |
| Black, African American, or African | 23% | 34% |
| Asian | <1% | 1% |
| American Indian, Alaska Native, or Indigenous | 6% | 5% |
| Native Hawaiian or Pacific Islander | <1% | 1% |
| Middle Eastern or North African | <1% | <1% |
| Multiple Races | 2% | 3% |
By age group
| Age group | Unsheltered | Sheltered |
|---|---|---|
| Children, 0–17 | 2% | 24% |
| Youth, 18–24 | 6% | 7% |
| Adults, 25–64 | 88% | 61% |
| Older Adults, 65+ | 4% | 9% |
By ethnicity
| Ethnicity | Unsheltered | Sheltered |
|---|---|---|
| Hispanic/Latina(e)(o) | 30% | 24% |
| Non-Hispanic/Non-Latina(e)(o) | 70% | 76% |
Interpretation
The 2026 PIT Count showed a higher share of people identifying as male than Maricopa County, where the American Community Survey (ACS) reports a 50% male/50% female split. Adults 35–44 were the largest age group in the PIT Count at 22%, followed by adults 25–34 at 20%; children (0–17) accounted for 14%, while youth (18–24) and older adults (65+) each made up 7%. Overall, adults 25+ comprised 80% of the PIT Count, compared with 68% of Maricopa County residents per ACS. The PIT Count's racial makeup also differed from the county: ACS reports Maricopa County as White (59%), Black or African American (6%), Asian (5%), American Indian or Alaska Native (2%), Native Hawaiian or Other Pacific Islander (<1%), and Multiple or Other Races (29%). A higher share of PIT respondents also identified as Non-Hispanic or Non-Latina(e)(o) than countywide, where ACS reports 69%.
In 2025, HUD revised its required Universal Data Elements (UDEs) and the Maricopa Regional CoC Board aligned community UDEs to match: gender is no longer collected and sex is reported as male/female. Unsheltered respondents are fully represented in sex figures; sheltered figures include only providers that ask the question. HUD also treats "Hispanic or Latina(e)(o) Only" as its own race/ethnicity category, shown separately above.
County comparison figures: U.S. Census Bureau, American Community Survey 2024 1-Year Estimate.
Special Populations
The PIT Count tracks several special populations defined by HUD. Each total reflects people counted in shelter and on the street on the night of the count.
Families
The 2026 PIT Count identified 611 families experiencing homelessness, with a total of 2,103 persons in families. From 2020 to 2026, the number of families has increased by 11%.
Families are defined in this report as households with at least one adult and one child. Almost all families identified from the PIT Count were in either emergency shelter or transitional housing. Unsheltered families may be hard for volunteers to identify during the PIT Count due to tendencies to stay in vehicles or other hidden locations. Family service providers reached out and conducted interview surveys over the phone to better count the number of families experiencing homelessness.
| Year | Families |
|---|---|
| 2020 | 548 |
| 2022 | 550 |
| 2023 | 563 |
| 2024 | 598 |
| 2025 | 539 |
| 2026 | 611 |
Unaccompanied Youth, Age 18–24
Youth ages 18–24 are considered a vulnerable population, and the number decreased by 12% since last year.
Youth are also a challenging subpopulation to identify during the PIT Count. To account for this, homeless youth service providers have participated in the planning and survey process over the years to better understand this subpopulation and to capture the number of unaccompanied youth.
| Year | Unaccompanied youth |
|---|---|
| 2020 | 416 |
| 2022 | 624 |
| 2023 | 542 |
| 2024 | 536 |
| 2025 | 555 |
| 2026 | 478 |
Veterans
The number of veterans experiencing homelessness has decreased by 9% since last year.
The number of veterans experiencing sheltered and unsheltered homelessness on the night of the count has gone up and down over the years. This year, the number of unsheltered and sheltered veterans both decreased. It is important to note that veteran status is self-reported in the PIT Count.
| Year | Veterans |
|---|---|
| 2020 | 494 |
| 2022 | 420 |
| 2023 | 505 |
| 2024 | 440 |
| 2025 | 462 |
| 2026 | 429 |
Chronically Homeless
Year-over-year growth in chronic homelessness has eased relative to prior years. The chronic unsheltered count rose by 7% since last year and the chronic sheltered count fell by 1%, while the cumulative increase from 2020 to 2026 stands at 88%.
| Year | Chronically homeless |
|---|---|
| 2020 | 1,052 |
| 2022 | 1,287 |
| 2023 | 1,906 |
| 2024 | 2,135 |
| 2025 | 1,930 |
| 2026 | 1,981 |
HUD defines chronic homelessness as: (1) a person who lives in a place not meant for human habitation, Safe Haven, or Emergency Shelter; (2) has a disability; and (3) has been homeless continuously for one year or four or more times in the last three years, with a combined length of homelessness of at least 12 months. When a head of household meets this definition, all household members are counted as chronically homeless.
Additional Populations
The PIT Count also collects information on other subpopulations based on self-reported, voluntary responses.
Show additional populations by year, 2019–2026
| Population | 2019 | 2020 | 2022 | 2023 | 2024 | 2025 | 2026 |
|---|---|---|---|---|---|---|---|
| Mental Illness | 966 | 965 | 1,022 | 1,333 | 1,309 | 1,208 | 1,273 |
| Substance Use (Alcohol/Drug) | 1,116 | 1,110 | 1,104 | 1,220 | 1,300 | 1,294 | 1,324 |
| HIV/AIDS | 117 | 157 | 135 | 149 | 181 | 147 | 138 |
| Domestic Violence | 805 | 576 | 470 | 637 | 667 | 626 | 622 |
The PIT Count was not conducted in 2021 due to the pandemic.
Regional Trends
Unsheltered Count
In 2026, unsheltered homelessness decreased. From 2023 to 2026, unsheltered homelessness in the Maricopa County region decreased by 20%. In the Central subregion (Phoenix), unsheltered homelessness decreased by 3%. In the East Valley, unsheltered homelessness decreased by 16%, and in the West Valley, it decreased by 36%.
Unsheltered Count by Subregion, 2023–2026
| Subregion | 2023 | 2024 | 2025 | 2026 |
|---|---|---|---|---|
| Central | 3,333 | 2,701 | 3,761 | 3,248 |
| East Valley | 1,048 | 877 | 940 | 907 |
| West Valley | 526 | 483 | 499 | 386 |
Unincorporated Maricopa County is excluded from the subregions.
Show unsheltered count by municipality, 2023–2026 (27 rows)
| Municipality | 2023 | 2024 | 2025 | 2026 |
|---|---|---|---|---|
| Avondale | 45 | 46 | 62 | 38 |
| Buckeye | 60 | 25 | 89 | 58 |
| Carefree | 0 | 0 | 0 | 0 |
| Cave Creek | 0 | 0 | 0 | 0 |
| Chandler | 116 | 115 | 137 | 94 |
| El Mirage | 26 | 15 | 5 | 14 |
| Fountain Hills | 2 | 1 | 5 | 2 |
| Gila Bend | 7 | 10 | 10 | 9 |
| Gilbert | 17 | 16 | 22 | 35 |
| Glendale | 170 | 211 | 169 | 92 |
| Goodyear | 22 | 30 | 5 | 9 |
| Guadalupe | 75 | 74 | 96 | 34 |
| Litchfield Park | 0 | 0 | 0 | 0 |
| Mesa | 366 | 309 | 262 | 343 |
| Paradise Valley | 2 | 0 | 0 | 0 |
| Peoria | 92 | 82 | 95 | 76 |
| Phoenix | 3,333 | 2,701 | 3,761 | 3,248 |
| Queen Creek | 1 | 7 | 7 | 8 |
| Scottsdale | 64 | 89 | 105 | 108 |
| Sun City | 4 | 0 | 0 | 4 |
| Surprise | 67 | 49 | 38 | 63 |
| Tempe | 406 | 266 | 306 | 283 |
| Tolleson | 7 | 7 | 11 | 0 |
| Wickenburg | 6 | 0 | 2 | 6 |
| Youngtown | 20 | 8 | 13 | 17 |
| Unincorporated Maricopa County | 8 | 15 | 7 | 26 |
| Total | 4,908 | 4,076 | 5,207 | 4,567 |
Locations of 2026 Unsheltered Surveys
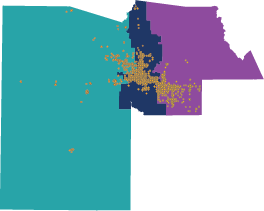
City of Phoenix data includes 201 people who were staying at the Safe Outdoor Space, a structured outdoor shelter that provides meals, laundry, shower facilities, and onsite case management.
Sheltered Count
Most people experiencing sheltered homelessness during the 2026 PIT Count were in Emergency Shelters. The majority of Emergency Shelter, Transitional Housing, and Safe Haven* programs are located in Phoenix.
Sheltered population by program type
Emergency Shelter
Transitional Housing
Safe Haven*
| Program type | Share |
|---|---|
| Emergency Shelter | 71% |
| Transitional Housing | 28% |
| Safe Haven* | 1% |
Sheltered Count by Subregion
| Subregion | 2023 | 2024 | 2025 | 2026 |
|---|---|---|---|---|
| Central | 3,569 | 4,097 | 3,514 | 4,041 |
| East Valley | 1,092 | 1,086 | 771 | 851 |
| West Valley | 73 | 176 | 242 | 267 |
| Total | 4,734 | 5,359 | 4,527 | 5,159 |
During the 2023 and 2024 Point-in-Time Count, many temporary hotels offering shelter were funded through American Rescue Plan funding, which effectively ended in 2025.
*Maricopa County no longer has "Safe Haven" projects; however, certain veteran grant per diem beds are required by HUD to be reported as Safe Haven for the PIT Count.
Methodology
Every year, hundreds of volunteers, staff, and outreach workers participate in the PIT Count across the Maricopa County region. The unsheltered count relies on interview and observation survey responses. All cities and towns except for Phoenix do a direct census count. The City of Phoenix uses an extrapolation method that identifies high and low density grids. High density grids are counted via complete census, while a random sample of low density grids are counted and extrapolated.
In the past, PIT Count volunteers used paper survey forms, but in recent years all surveys are submitted electronically through a mobile app. Due to its ease of use, volunteers have been able to complete more surveys when using the mobile app to fill out the forms.
The sheltered count comes from the region's Homeless Management Information System (HMIS) and service provider surveys to verify the number of beds and occupancy rates for each program. Missing demographic information is extrapolated from known information using the HUD PIT extrapolation tool.
Additional Data
Aside from the annual Point-in-Time Count, there are additional data tools and resources that provide information on homelessness and housing affordability in the region:
- The Homelessness Trends Report is an infographic report summarizing quarterly trends in homelessness data. Data comes from the Homeless Management Information System (HMIS) and includes metrics on clients/households served, system flow, demographics, subpopulations, and an overview of system performance measures. azmag.gov/Homelessness-Trends
- System Performance Measures (SPMs) are metrics that are reported to HUD by our Continuum of Care, designed to measure progress towards resolving homelessness. The SPM dashboard shows trends for Maricopa County by annual submissions going back to 2018, and by quarter for the last year. azmag.gov/CoC-SPM
Special thanks to the 2026 PIT Count Municipal Coordinators, volunteers, staff, and outreach teams who put in time and effort to make this a successful count; Solari for collecting and verifying provider data for the Housing Inventory Chart and Sheltered Count; and to those experiencing homelessness who were willing to speak with us about their experiences.
For more information, visit maricopacoc.org/data/point-in-time-count.
Prepared by the Maricopa Association of Governments (MAG) for the Maricopa Regional Continuum of Care.